
UX Intern at Walmart
A New Generation Data Governance Platform
UX, UI, Research
Grad Project | Ongoing
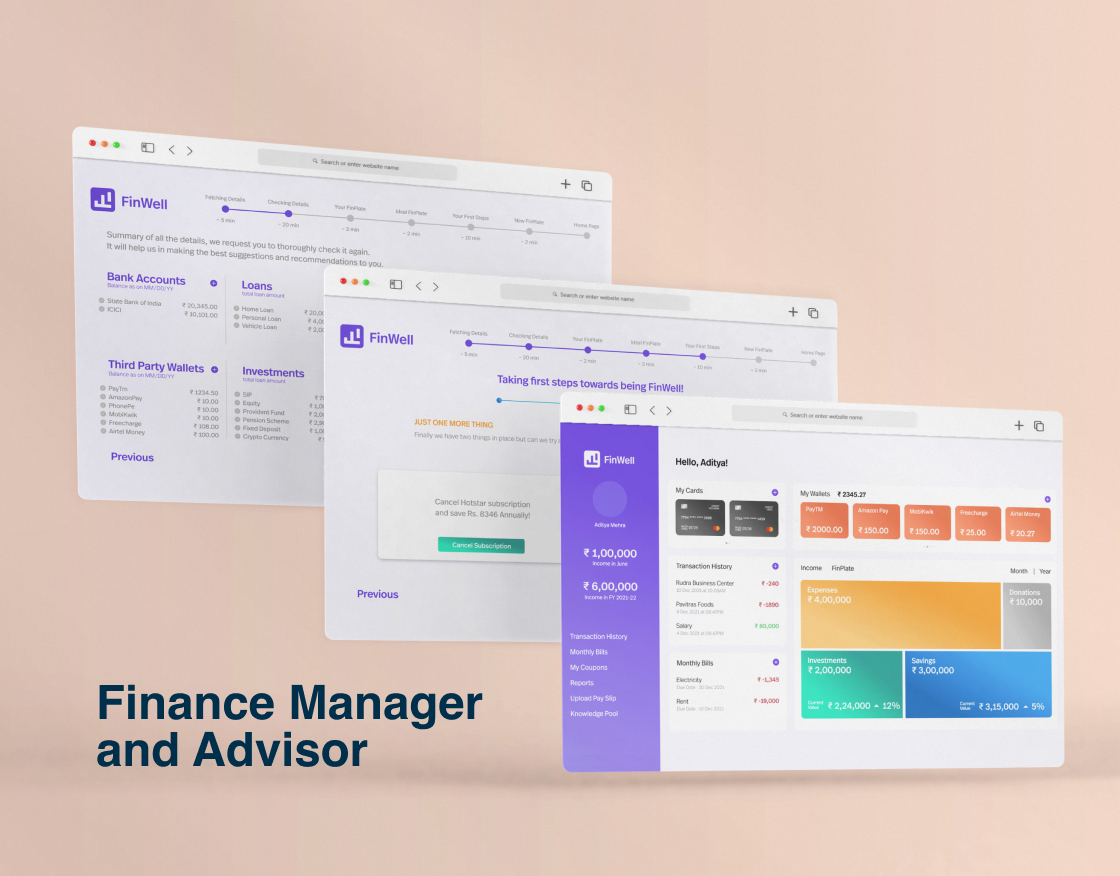
FinWell
A solution that provides you with an overview of your money
UX, UI, Research
Course Assignment | 8 Weeks
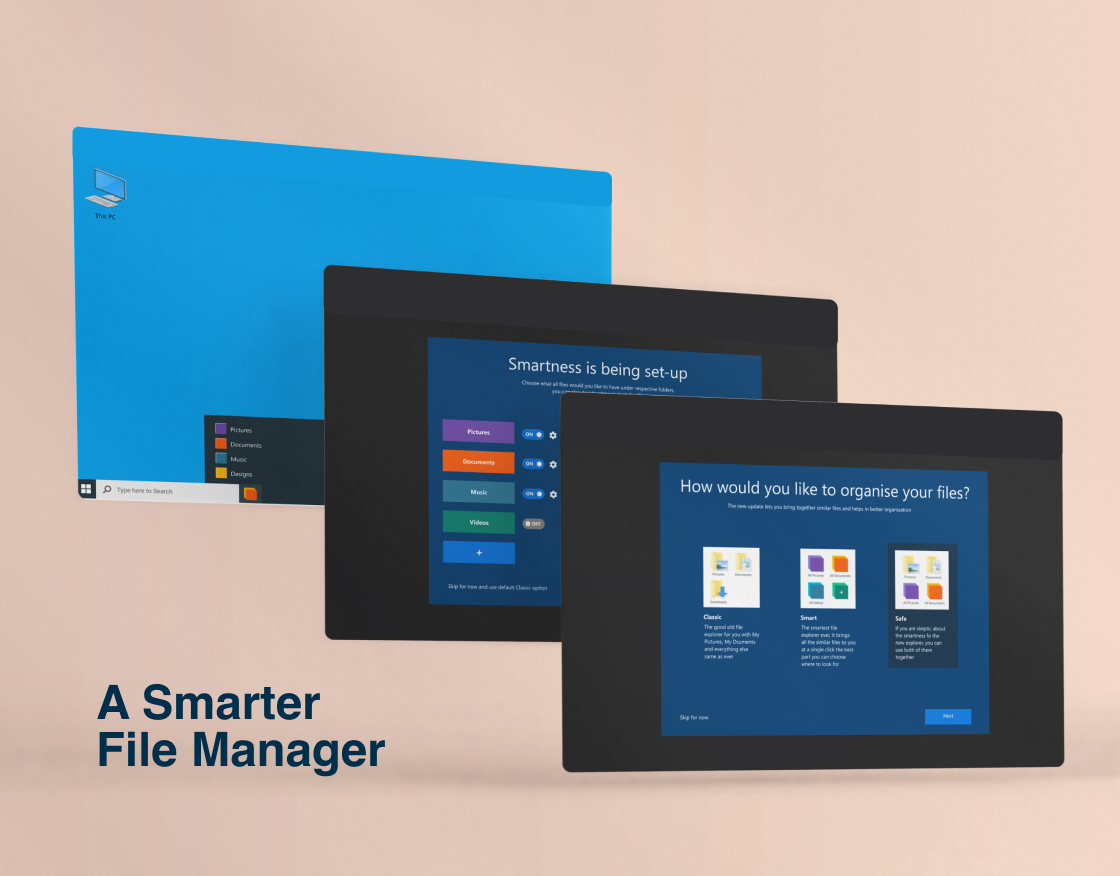
A Smarter File Explorer
Usability Study and modifying Windows File Explorer
UX, UI, Research
Course Assignment | 2 Weeks
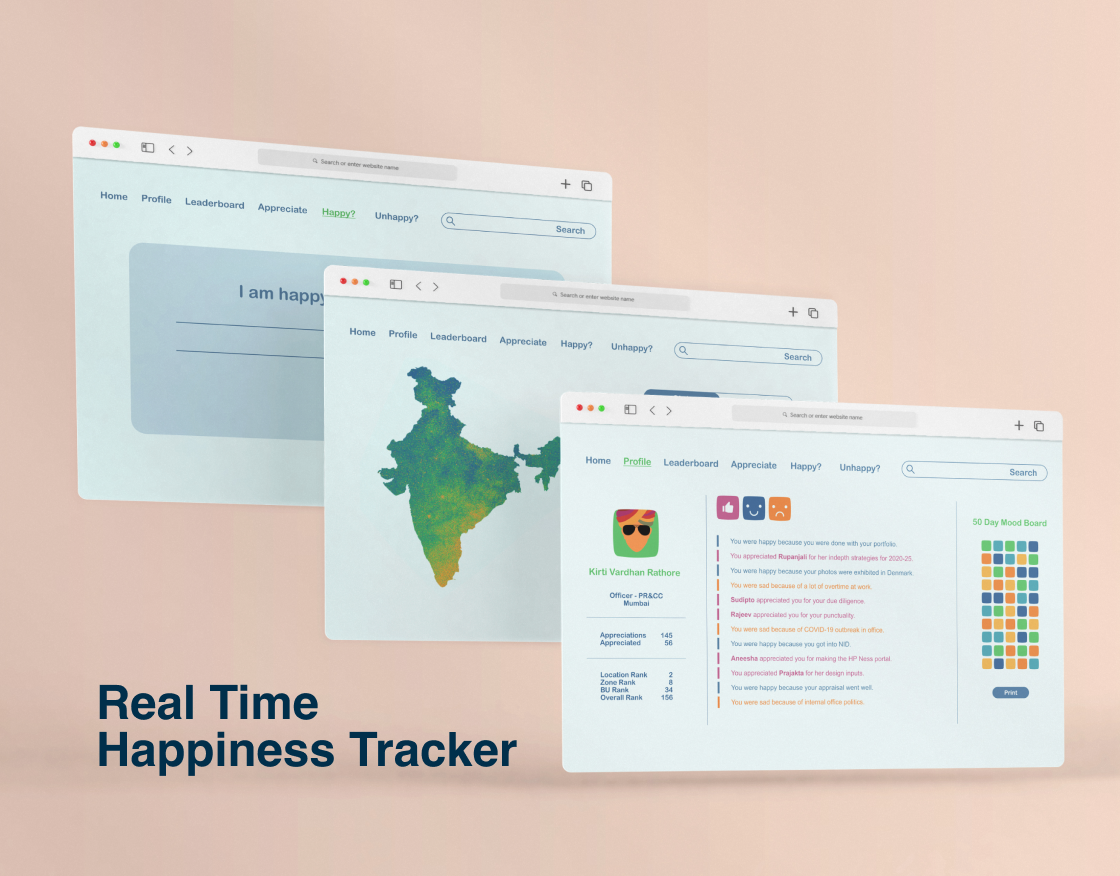
HP NESS
Happiness Tracker for Hindustan Petroleum, is also a platform to share appreciations to your colleagues, your happy as well as not so happy stories
UX, UI, Research
Hindustan Petroleum Corp. Ltd.
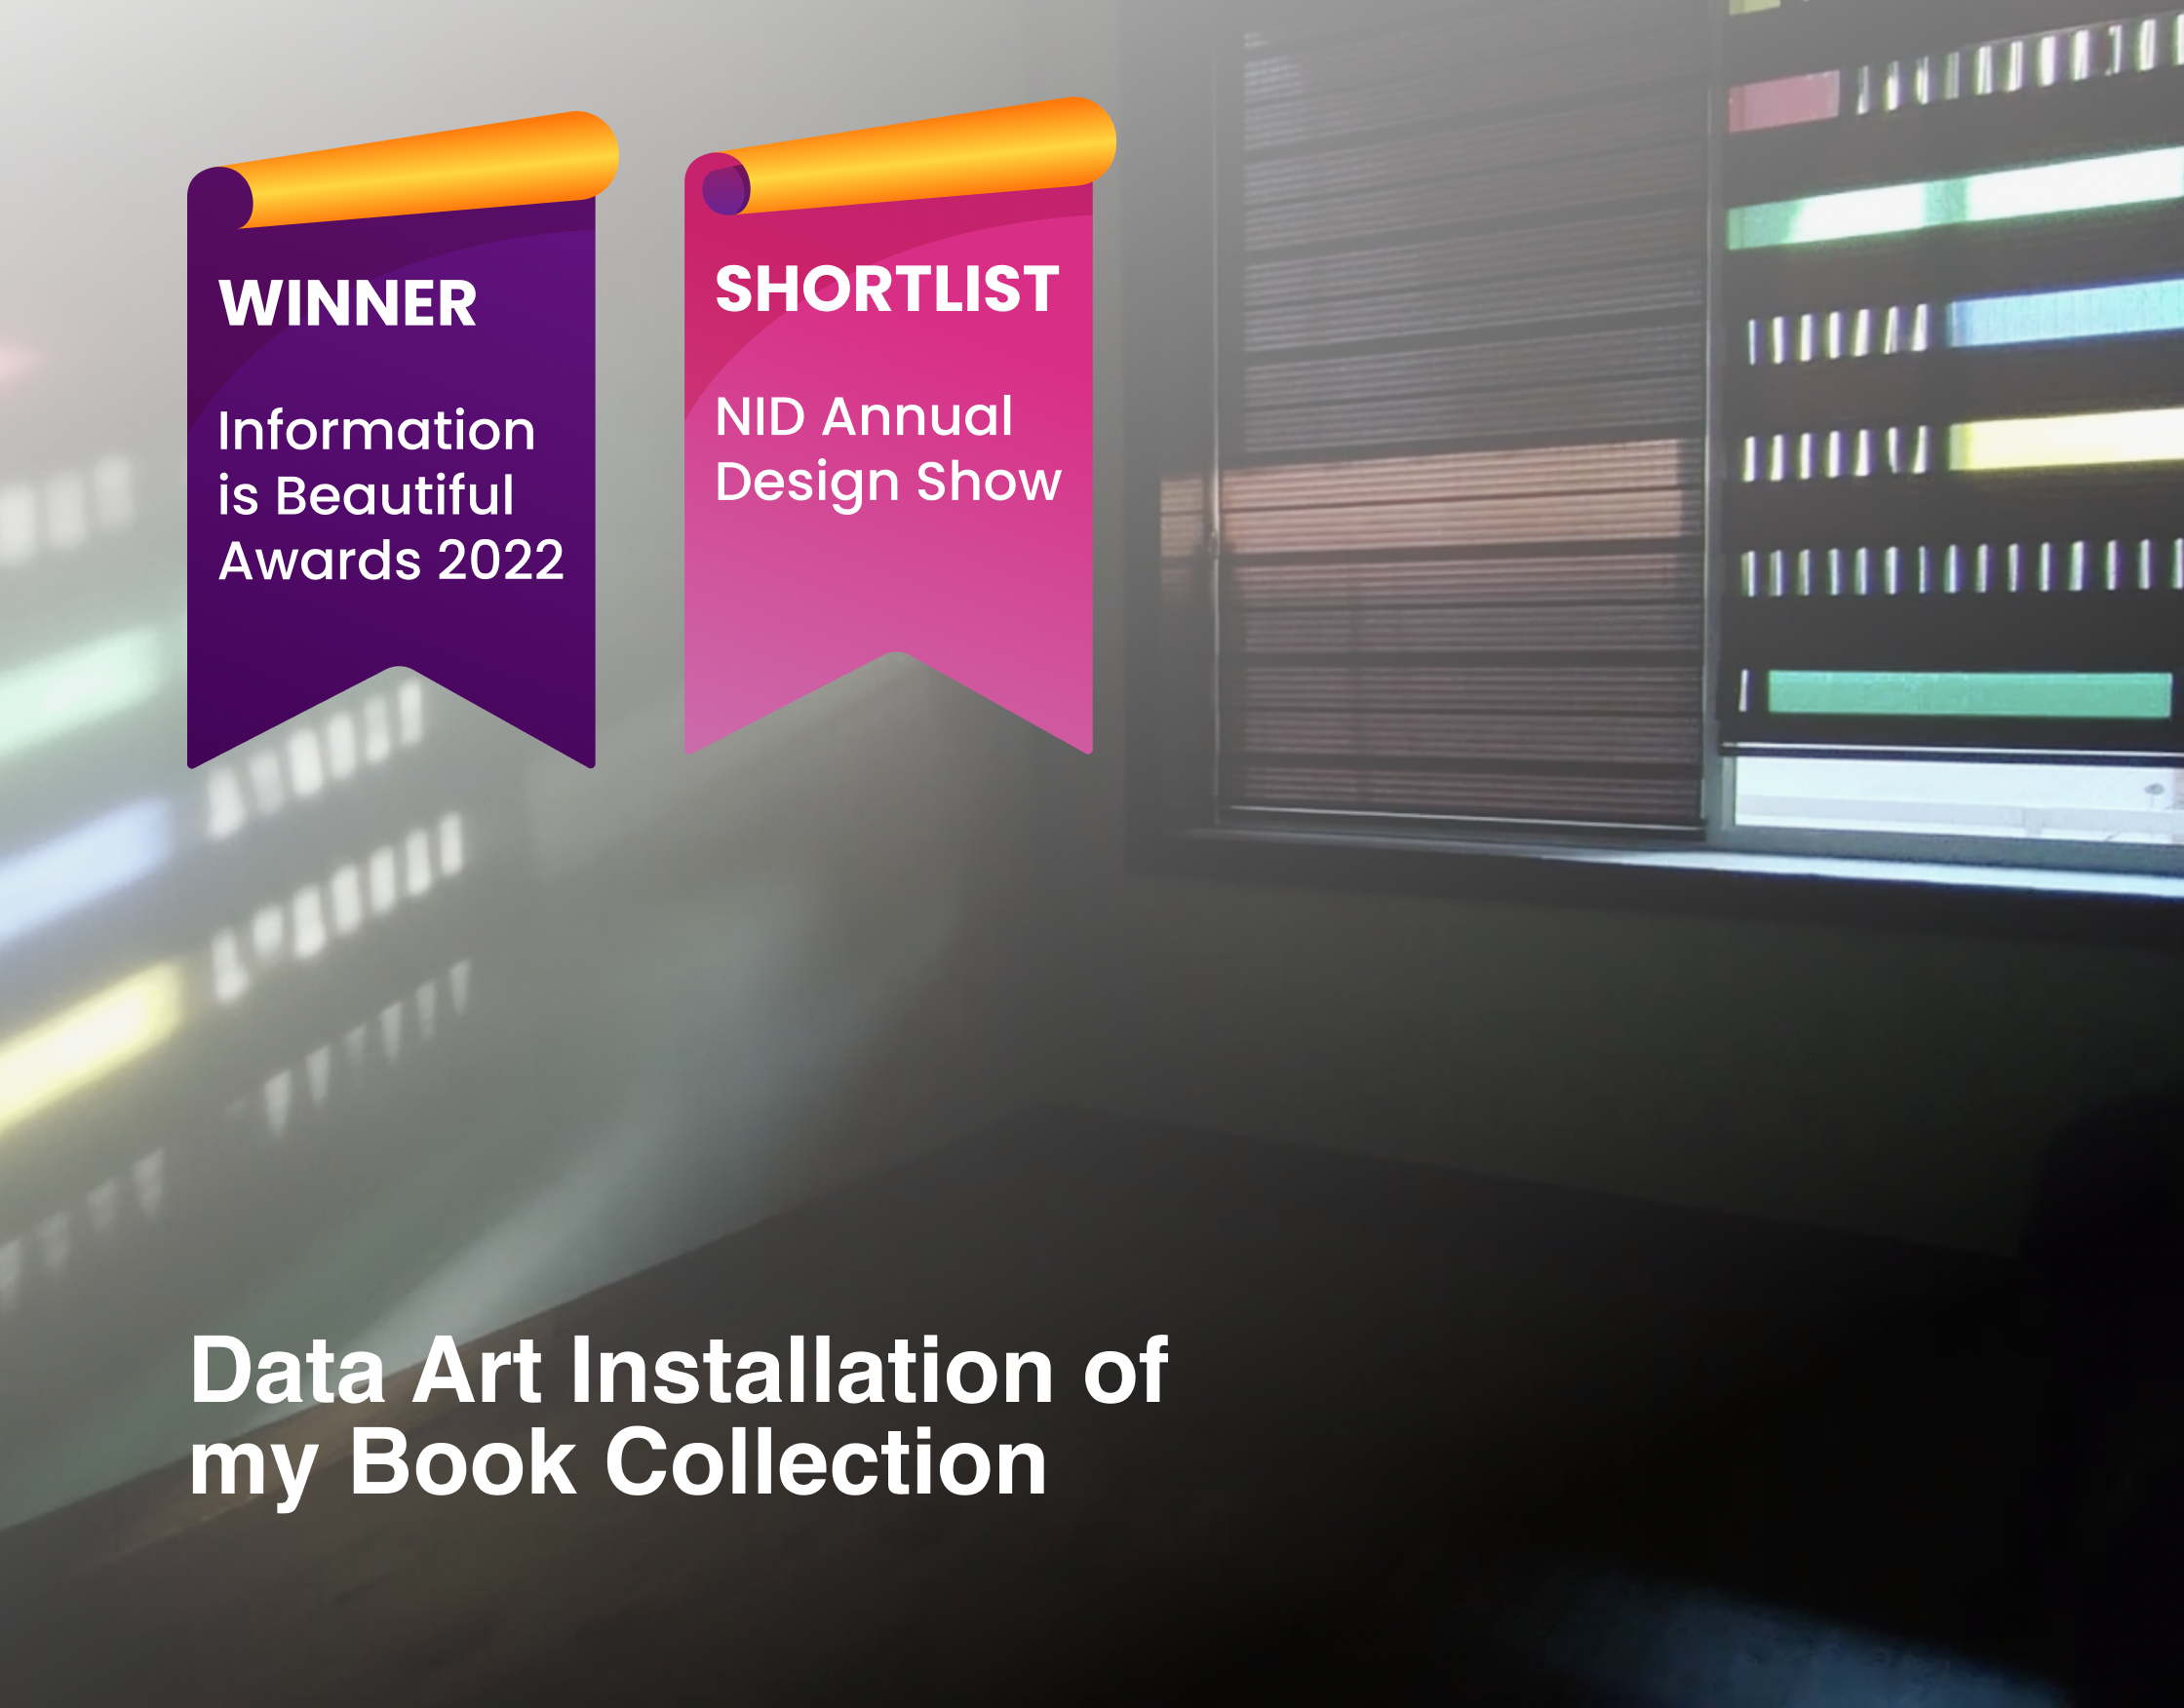
Lumos Maxima
Visualization of my Book Collection using Sunlight
Art Installation
Course Assignment | 1 Weeks
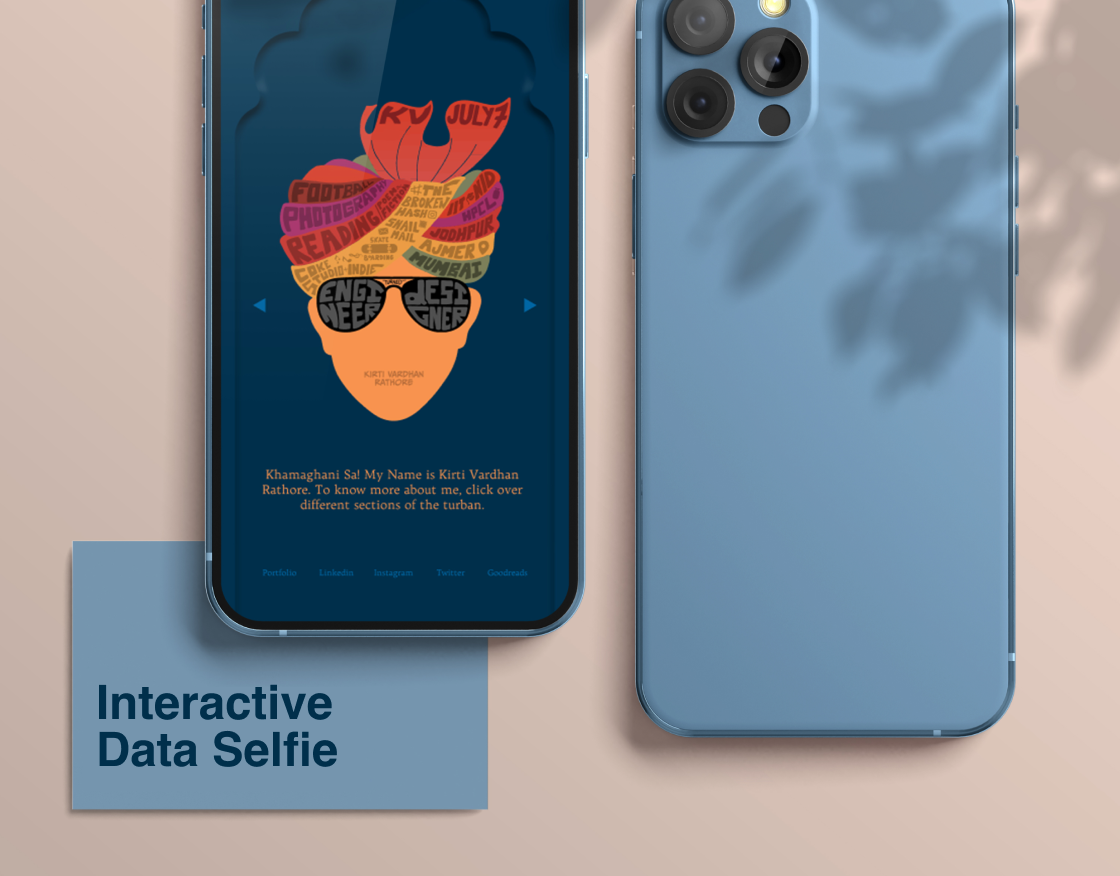
रंग, विचार, सपने और मैं
Colours, thoughts, dreams and me. A selfie that is made using data
Information Visualization
Course Assignment | 2 Weeks
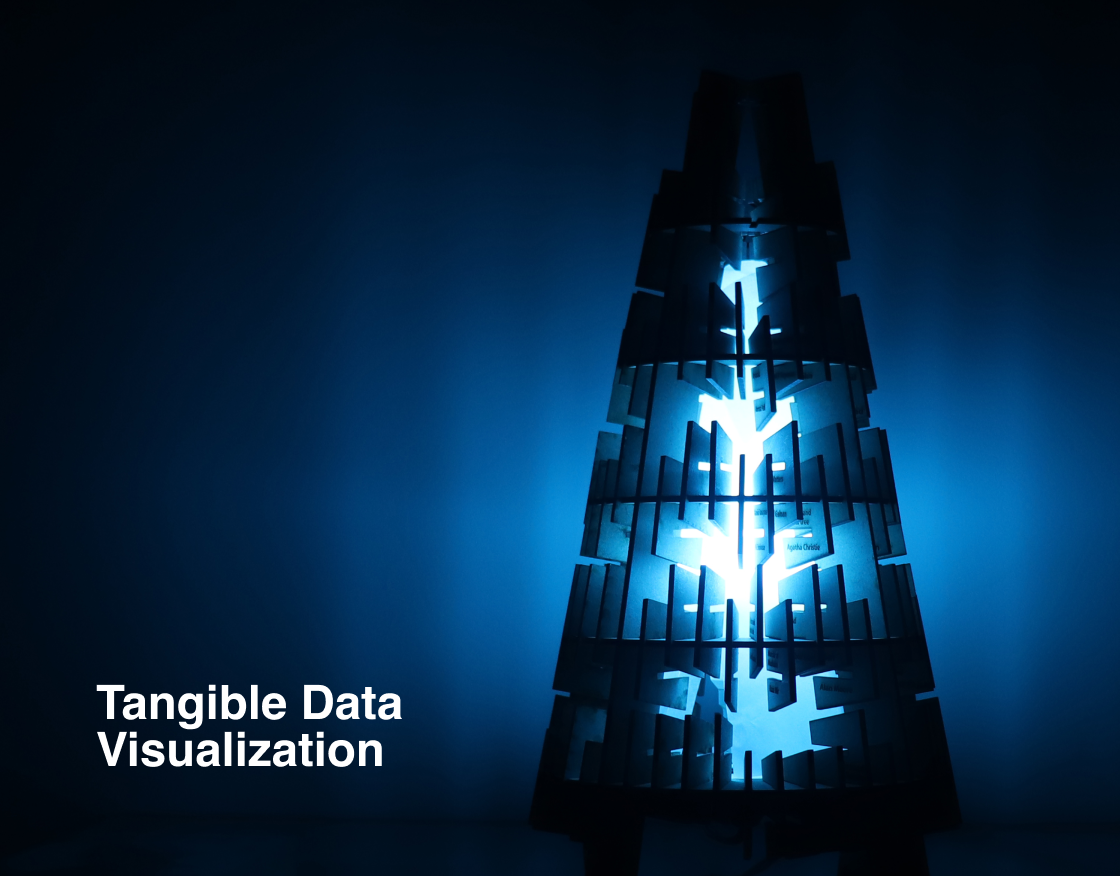
prakash-e-gyaan
Visualizing my reading habit using light
Tangible Data Visualisation
Course Assignment | 2 Weeks
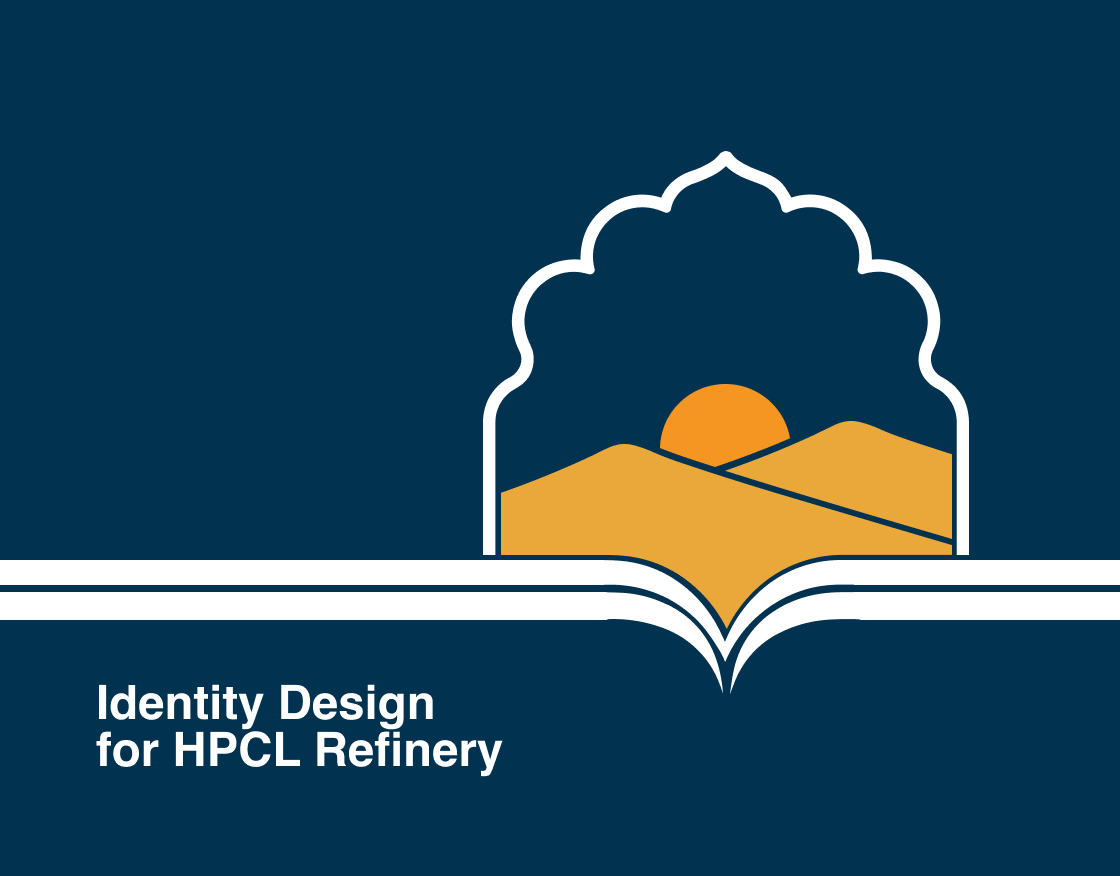
Rajasthan Refinery : Sunrise in the land of Kings!
The backstory about the design that made me realize, design is the way!
Identity Design
Hindustan Petroleum Corp. Ltd.
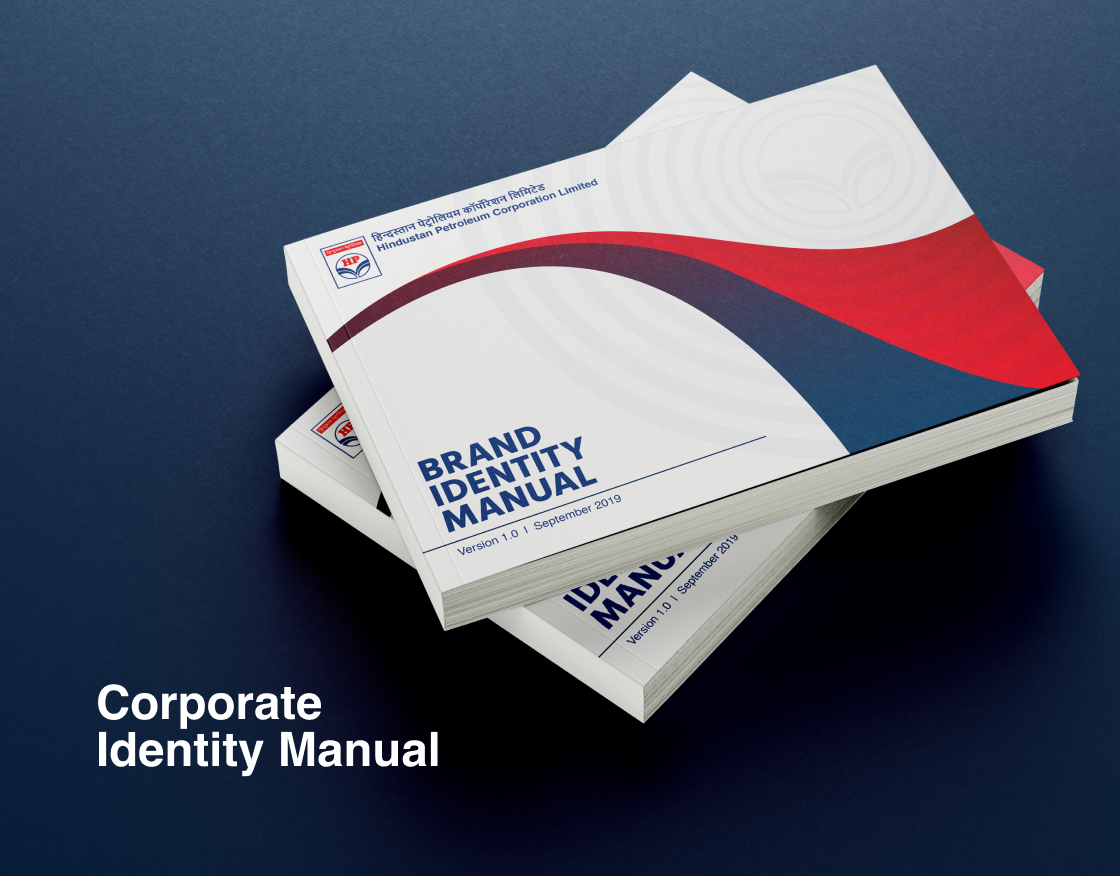
Corporate Identity Manual
Designing Brand Guidelines for HPCL corporate logo and new Corporate Stationery
Brand Standardisation
Hindustan Petroleum Corp. Ltd.
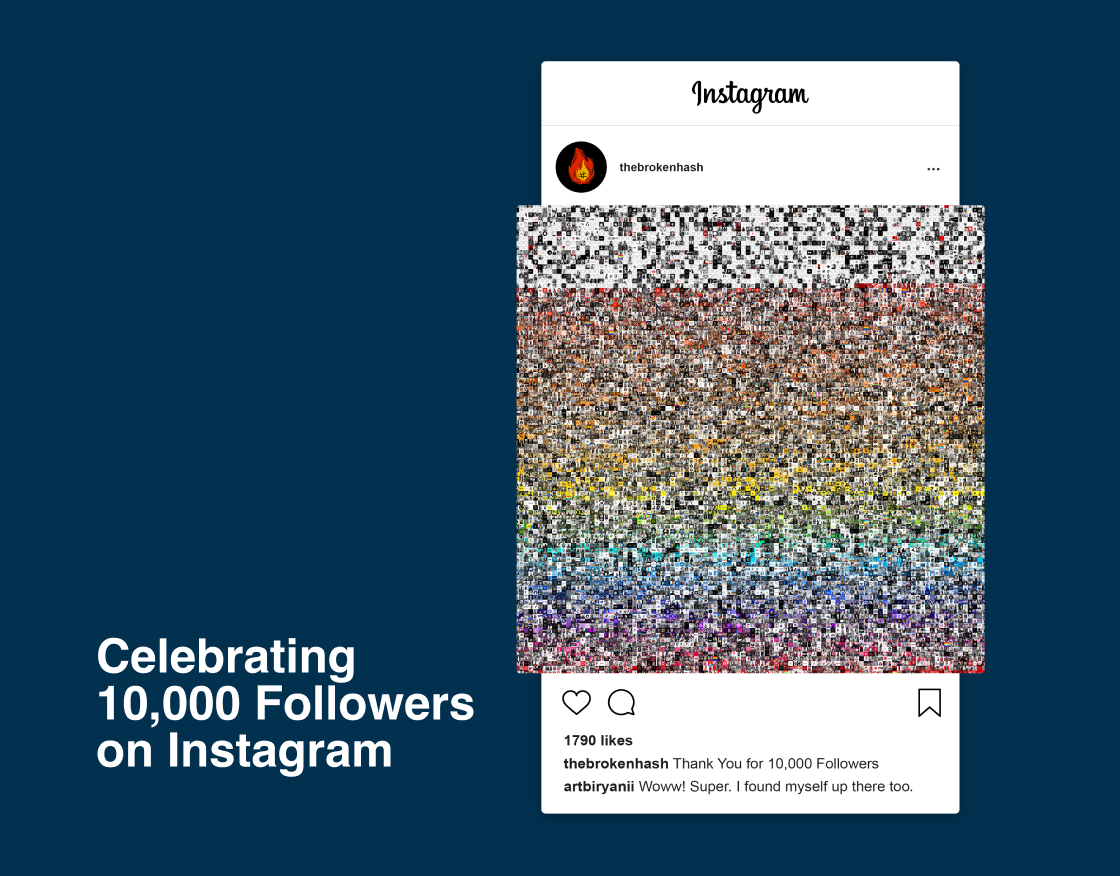
10K Followers
Celebrating 10,000 followers on Instagram using a collage of profile pictures of all the followers
Scrapping, Image Processing
Personal Project
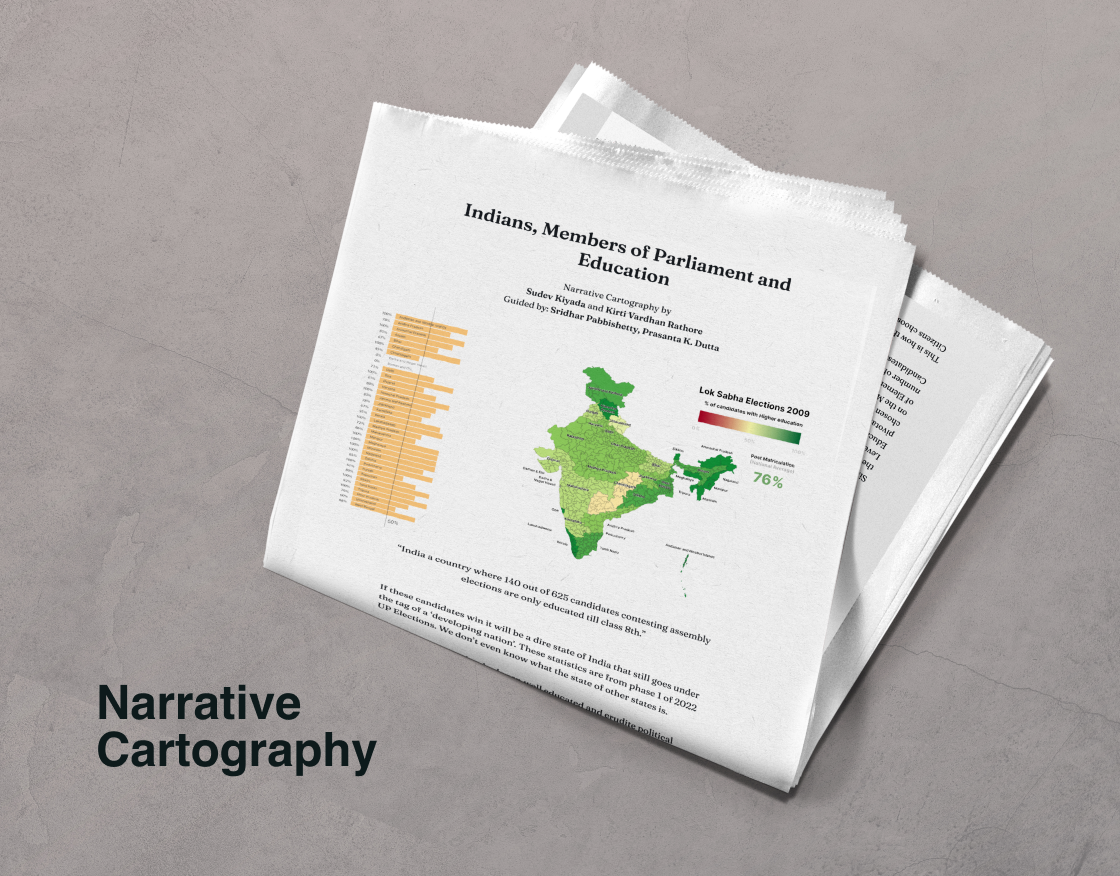
Indians, Members of Parliament and Education
Analyzing the educational qualification of MPs and MP Candidates
Cartography Data Narrative
Course Assignment | 3 Weeks (Team of 2)
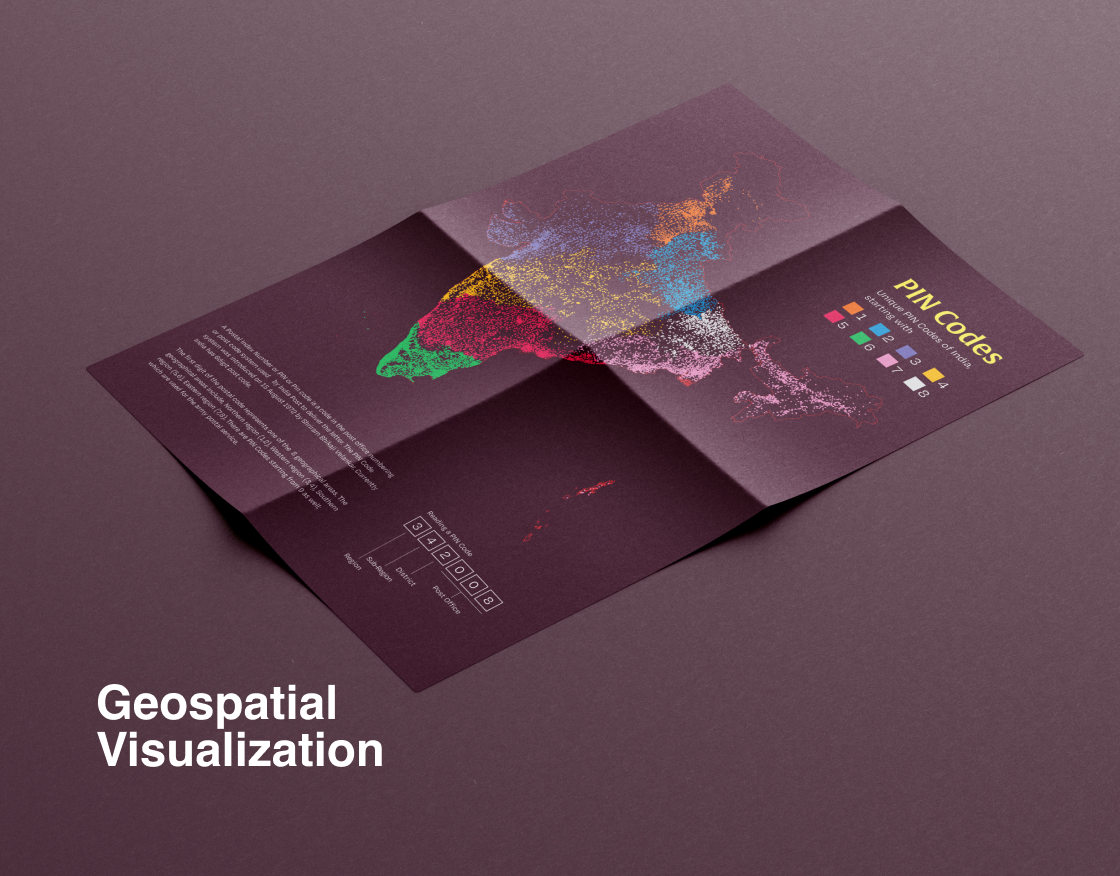
PIN Codes of India
Mapping unique PIN Codes of India using QGIS
Cartography
Course Assignment | 1 Week
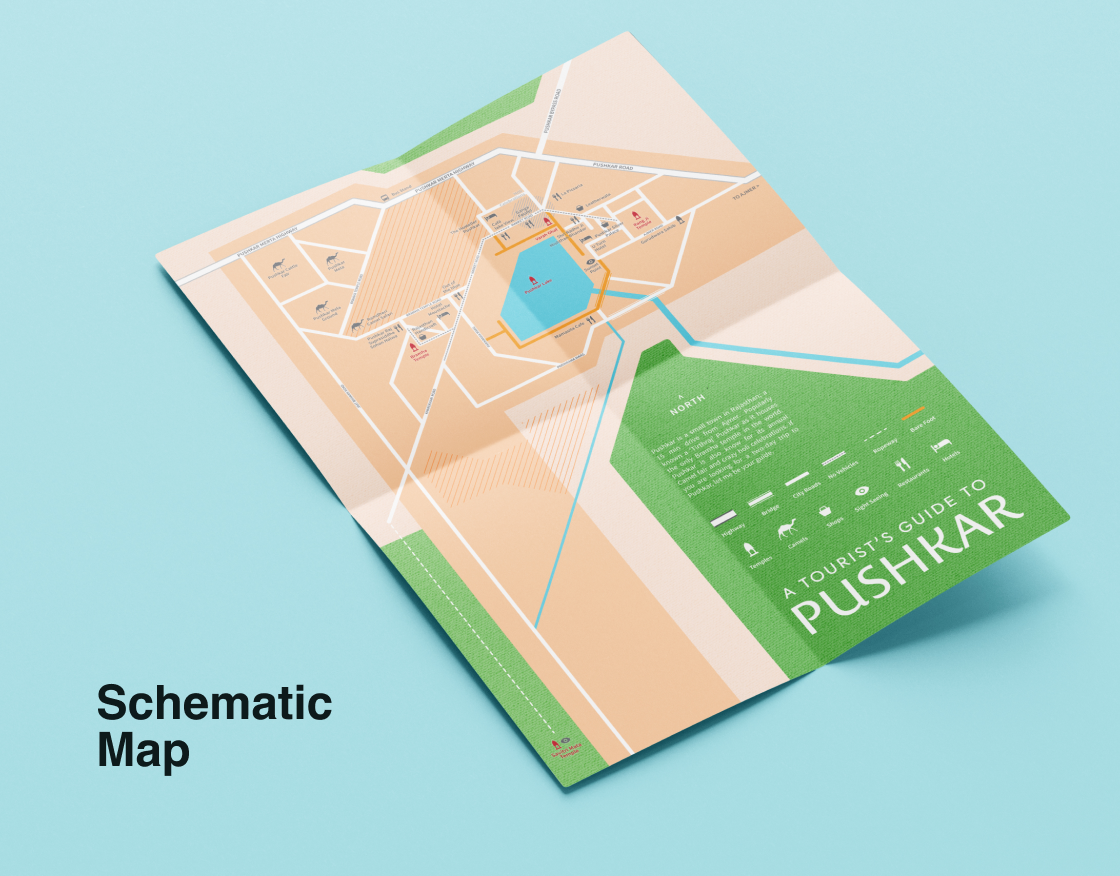
A Tourist's Guide to Pushkar
Schematic Map of Pushkar to guide someone who is on a two-day trip to the city
Cartography
Course Assignment | 1 Week
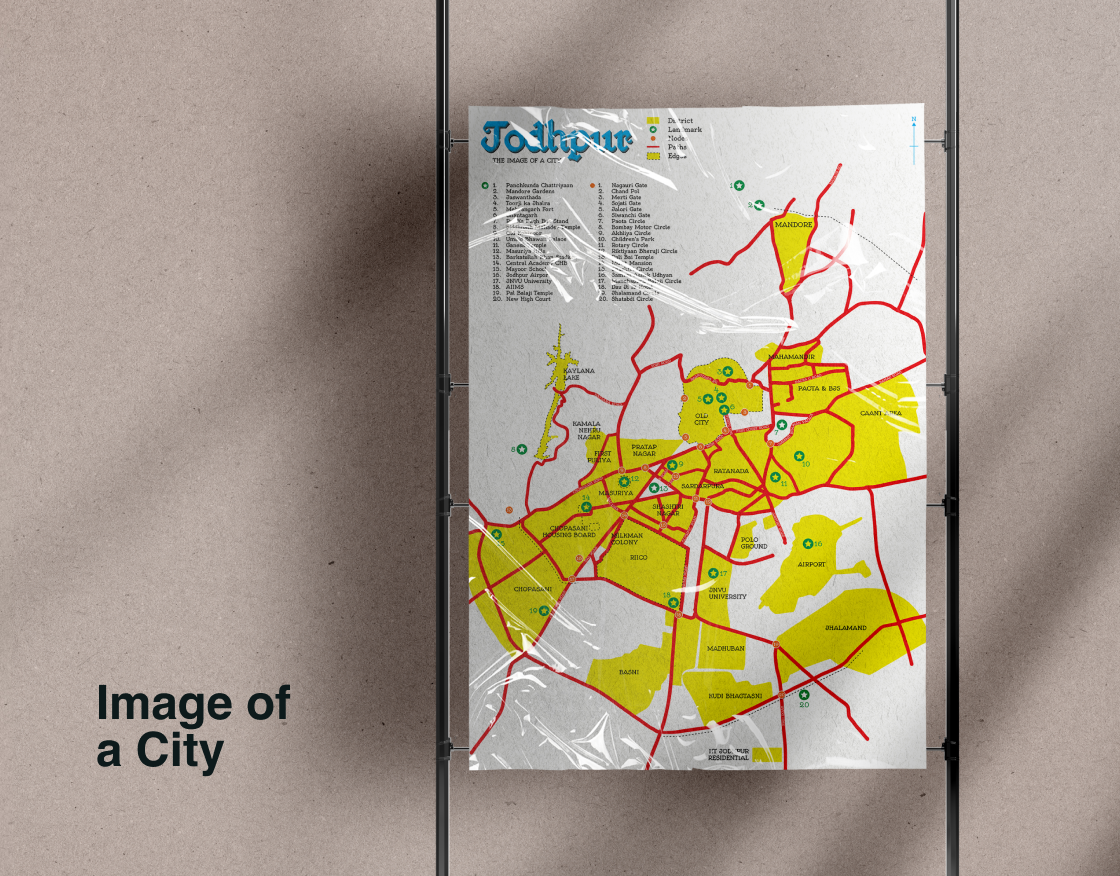
Mapping Jodhpur
Using Kevin Lynch's Image of a City to map Districts, Landmarks, Nodes, Paths and Edges of Jodhpur
Way-finding
Course Assignment | 1 Week
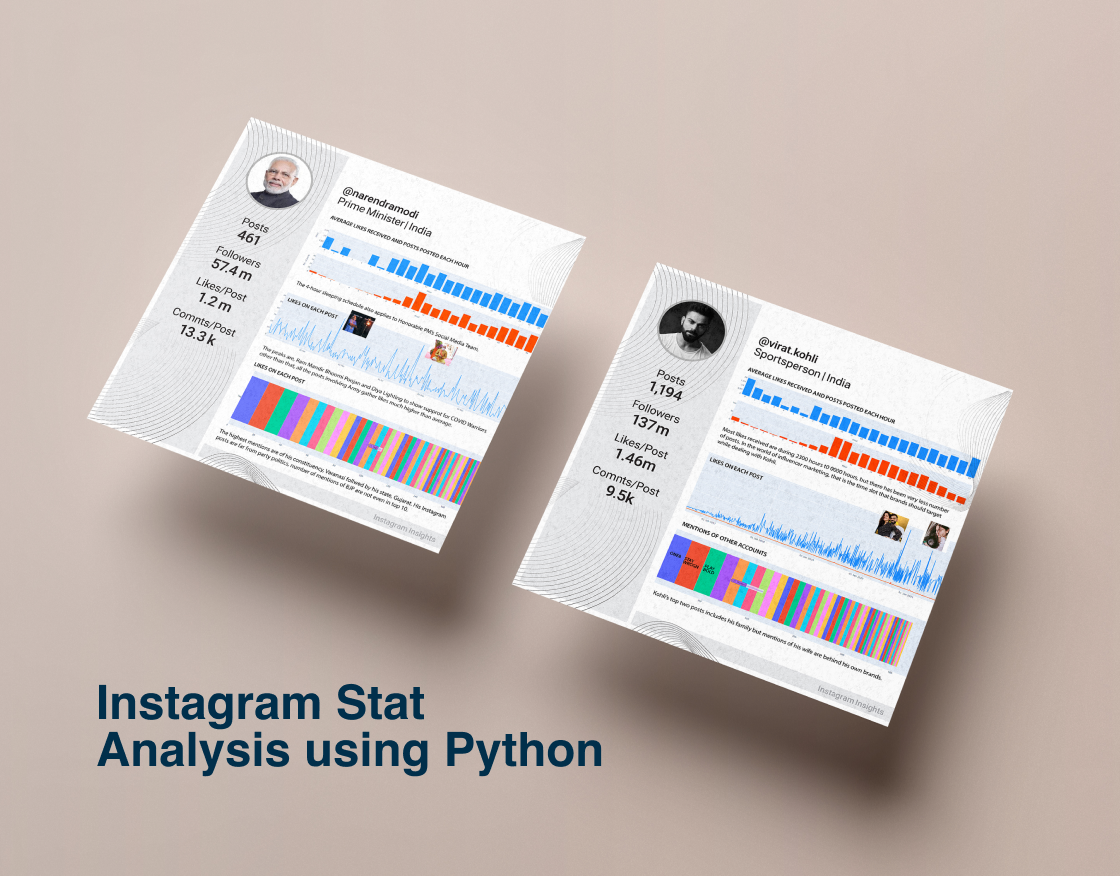
Instagram Insights
Analyzing Instagram Accounts using Python
Data Visualization
Course Assignment | 3 Weeks (Team of 2)
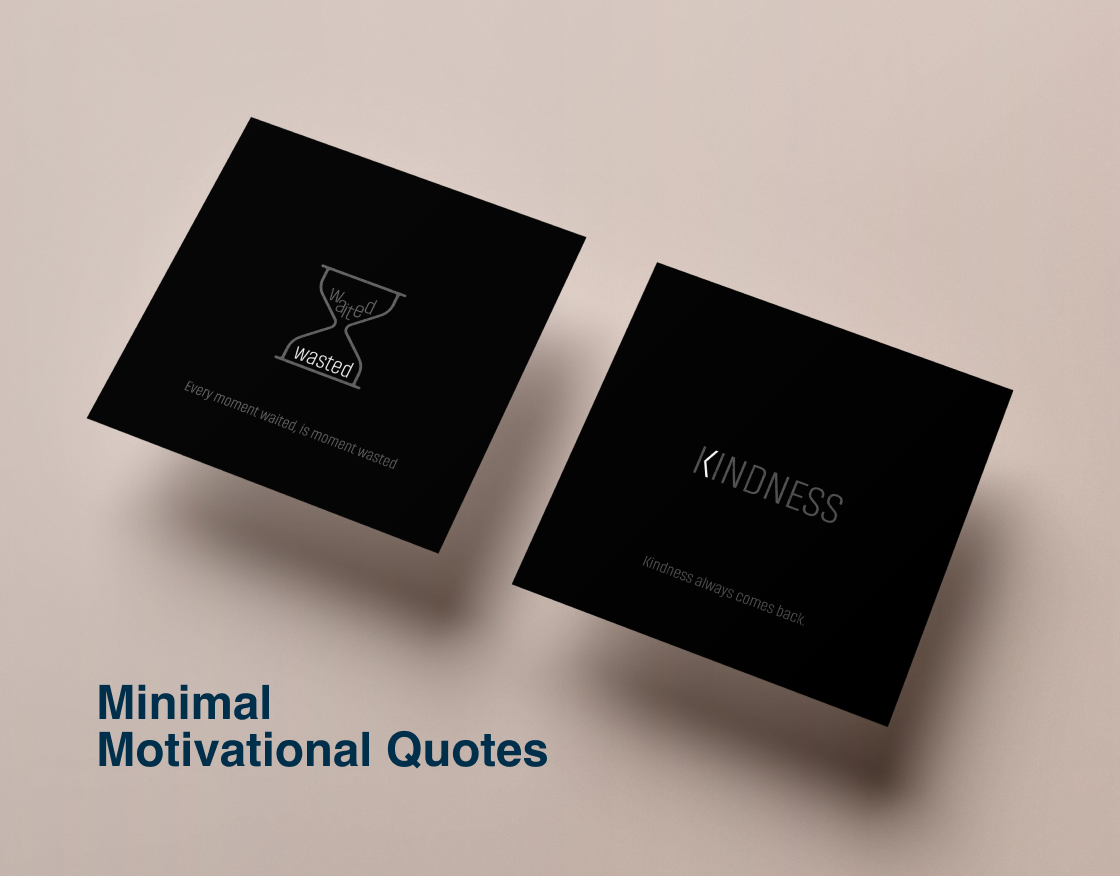
Khair, Good Morning
Visualizing motivational quotes in a minimal way and using three colors
Visual Design
Personal Project
How Far we have come?
Analysis of Independence Day Speeches to see India’s progress
Data Narrative
Duration : 2 Weeks